Business PointSaaS Growth & Exit Advisory

SaaS Exit Readiness Framework

Key metrics to evaluate your SaaS business

A practical guide to the 20 metrics that matter most when assessing, preparing, and positioning a SaaS business for growth or exit.
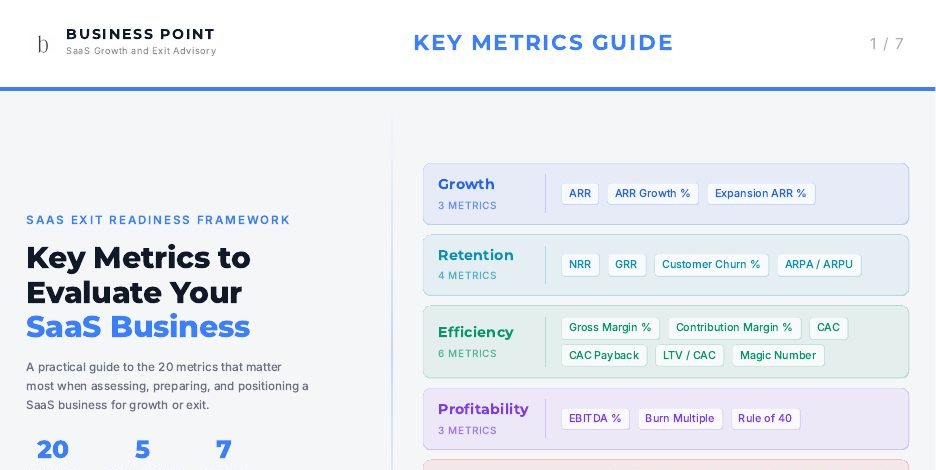
Cover of the Key Metrics Guide

Growth

3 metrics

ARR

1 of 20

Annual recurring revenue

Monthly Recurring Revenue × 12

What good looks like
Clear, defensible recurring revenue with minimal one-off revenue mixed in
Why it matters
ARR is the starting point for most SaaS valuations

ARR Growth %

2 of 20

Annual recurring revenue growth

(Current ARR − Prior ARR) / Prior ARR

What good looks like
Strong year-on-year growth, preferably consistent rather than spiky
Why it matters
Growth is one of the biggest drivers of valuation multiple

Expansion ARR %

3 of 20

Expansion revenue

Expansion ARR / Starting ARR

What good looks like
Reliable upsell and cross-sell within existing customers
Why it matters
Expansion is usually lower risk and thus more valuable than brand-new logo acquisition

Retention

4 metrics

NRR

4 of 20

Net revenue retention

(Starting ARR + Expansion − Contraction − Churn) / Starting ARR

What good looks like
100%+ is solid, 110%+ is strong, 120%+ gets attention
Why it matters
Shows whether existing customers grow in value over time

GRR

5 of 20

Gross revenue retention

(Starting ARR − Contraction − Churn) / Starting ARR

What good looks like
85%+ for SMB, 90%+ for mid-market, 95%+ for enterprise
Why it matters
Isolates leakage (churn and downsell) before upsell and new sales hide the cracks

Customer Churn %

6 of 20

Logo churn

Customers Lost / Starting Customers

What good looks like
Low and stable, with no obvious pattern of early customer failure
Why it matters
High logo churn points to weak product-market fit, poor onboarding, or bad ICP discipline

ARPA / ARPU

7 of 20

Average revenue per account (or per user)

ARR / Number of Customers or Users

What good looks like
Stable or rising in the right customer segments
Why it matters
Helps buyers assess customer quality and segment attractiveness

Efficiency

6 metrics

Gross Margin %

8 of 20

Gross margin

(Revenue − Cost of Service Delivery) / Revenue

What good looks like
Aiming for 70% to 80% for subscription gross margin
Why it matters
Shows whether the model has real SaaS economics or is dragged down by service-heavy delivery

Contribution Margin %

9 of 20

Contribution margin

(Revenue − Variable Costs to Serve and Retain) / Revenue

What good looks like
Positive and improving as the business scales
Why it matters
Reveals whether each additional dollar of revenue creates improved profitability

CAC

10 of 20

Customer acquisition cost

Sales & Marketing Cost / New Customers Acquired

What good looks like
Efficient relative to contract value and payback period
Why it matters
Growth that costs a fortune is not attractive growth

CAC Payback

11 of 20

CAC payback period

CAC / Gross Profit from New Customer per Month

What good looks like
Under 12 months is strong, 12 to 18 months acceptable depending on segment
Why it matters
Measures how quickly growth spend turns back into cash

LTV / CAC

12 of 20

Lifetime value to CAC ratio

Customer Lifetime Value / CAC

What good looks like
3.0× or above is healthy; too high can imply underinvestment in growth
Why it matters
Shows whether customer acquisition is ultimately profitable

Magic Number

13 of 20

Sales efficiency

(QoQ ARR Growth × 4) / Prior Quarter Sales & Marketing Spend

What good looks like
0.75 or above is generally solid
Why it matters
Indicates whether go-to-market spend is translating into scalable growth

Profitability

3 metrics

EBITDA %

14 of 20

EBITDA margin

EBITDA / Revenue

What good looks like
Improving trend, with a credible path to scale economics
Why it matters
Shows revenue turning into profit

Burn Multiple

15 of 20

Burn multiple

Net Cash Burn / Net New ARR

What good looks like
Lower is better; under 1.5× is strong for a growth business
Why it matters
Shows capital efficiency in growth-stage SaaS

Rule of 40

16 of 20

Rule of 40

Revenue Growth % + EBITDA Margin %

What good looks like
40%+
Why it matters
A shorthand measure of balance between growth and profitability

Risk & Transferability

4 metrics

Subscription Revenue %

17 of 20

Revenue quality

Subscription Revenue / Total Revenue

What good looks like
High recurring mix, low dependency on projects or services
Why it matters
Recurring revenue is valued more highly than lumpy non-recurring work

Top Customer % of ARR

18 of 20

Customer concentration

Largest Customer ARR / Total ARR

What good looks like
No single customer should be able to make the business wobble
Why it matters
Concentration risk can drag valuation down quickly

Contract Quality

19 of 20

Average contract term and prepaid %

Avg months committed; Prepaid Revenue / Total Revenue

What good looks like
Annual contracts, prepaid billing, smooth renewals
Why it matters
Improves visibility, cash flow, and confidence in future revenue

Founder Dependence

20 of 20

Qualitative assessment

How much revenue, delivery, and key decisions depend on the founder

What good looks like
Business runs well without the founder in every major workflow
Why it matters
Buyers fear irreplaceability (dependence on heroes) and price accordingly

Want to know what a buyer would see if they looked at your business today?

The Exit Readiness Scorecard runs your business through the same framework we use in every Value Audit.

28 questions. 15 minutes. Free.

Take the scorecard

Prefer to talk first? Book a 30-minute conversation with David Francis.